


Reconciled Metal Variance and the Implications to Royalties and Streams
Reconciliation can have a substantial impact on revenue for royalty and stream holders
This is the third article on reconciliation. The first two can be found:
After introducing the concept of mine reconciliation, and covering the “how to”, we now explore the implications of metal reconciliation to royalty and streaming holders. Royalty/Streamers may be concerned if the actual metal production and net smelter revenue does not match the basis with which they made their investment decision.
We’ll go over reconciliation factors, methods for assigning variance, the potential politics of the decision, and how it can be done in a transparent and unbiased way.
Reconciliation Factors
Reconciliation factors are a quasi-standardized set of language that gives terminology to common reconciliations. Reconciliation factors will be briefly discussed here and may be given more time in a follow-up article. For interested readers, Ken Kuchling recently published a piece on mine-to-mill reconciliation, the need for standardization, and the efforts within industry to do so.
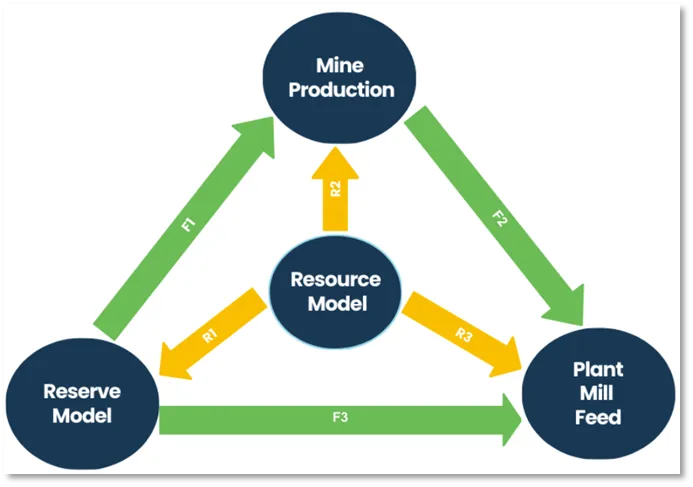
The mining industry is still working towards adopting common terminology regarding reconciliation factors, but the F-factors published by Harry Parker is one approach being applied. These are the following definitions for the main F-factors:
- F1: Production and reserve models are contrasted to test orebody geometry, interpolation and modifying factor estimates.
- F2: Mine production and mill delivered comparisons offer a valuable analysis of a reserve’s modifying factors (e.g. dilution and ore loss).
- F3: Operational capacity to recovery tonnage, grade and metal content of a given reserve.
Rayleen Hargreaves, of Datamine has been advocating for the R-factors, comparing the Resource model to the Reserve Model, Mine Production, and Plant Mill Feed and coming up with the diagram below.
End-of-Month Reconciliation
In the previous article, we calculated the actual and claimed crushed metal for a given period. If we follow the F-Factor terminology used by Parker, Hargreaves, and others:
A key geological function during end-of-month reporting, is to allocate the F2 variance back to the original ore sources. That is, the claimed mine production to the reconciled plant delivered (claimed to actual crushed).
 In the screen shot below from Pit info, we see that the ‘claimed crushed metal’ (mine production) for the month was 12,126oz while the ‘reconciled crushed metal’ (plat mill feed) for the month was 11,071oz.
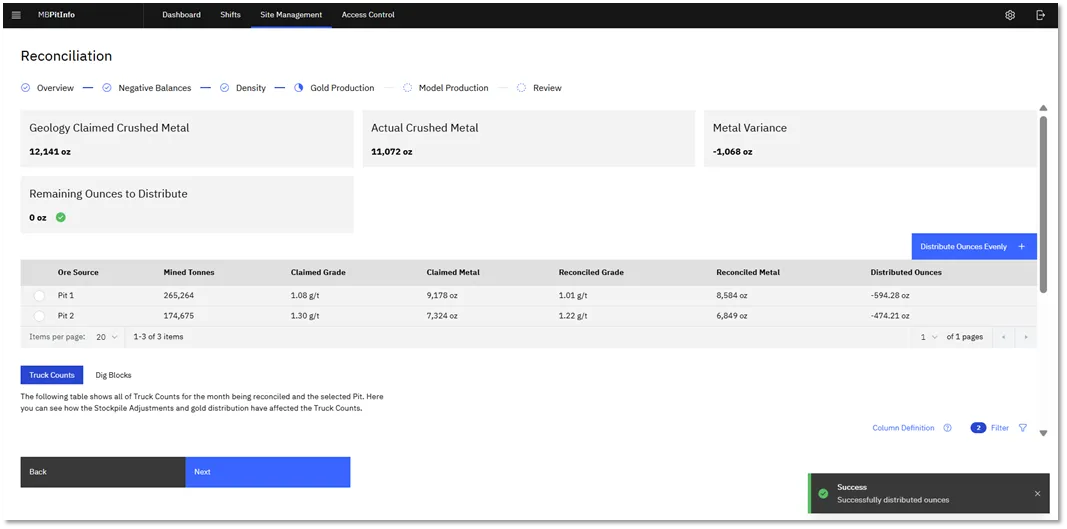 The F2 reconciliation factor is 0.91 which indicates a relatively well managed mine. Hargreaves says that reconciliation factors between 0.8-1.2 are acceptable.
How to assign metal variance to ore sources
The simplest way to allocate the variance is to split it between the ore sources weighted by metal. If for example, there is an overall F2 factor of 1.1, all ore sources will equally have their ‘actual crushed’ increased by 10%. This idea is formalized by the following formula:
 In the screen shot example below, we see:
 If the variance is being evenly distributed between the two ore sources:
 However, there are reasons, some sound and others politically motivated, why a geologist would be inclined to not distribute the variance evenly across the mined ore sources:
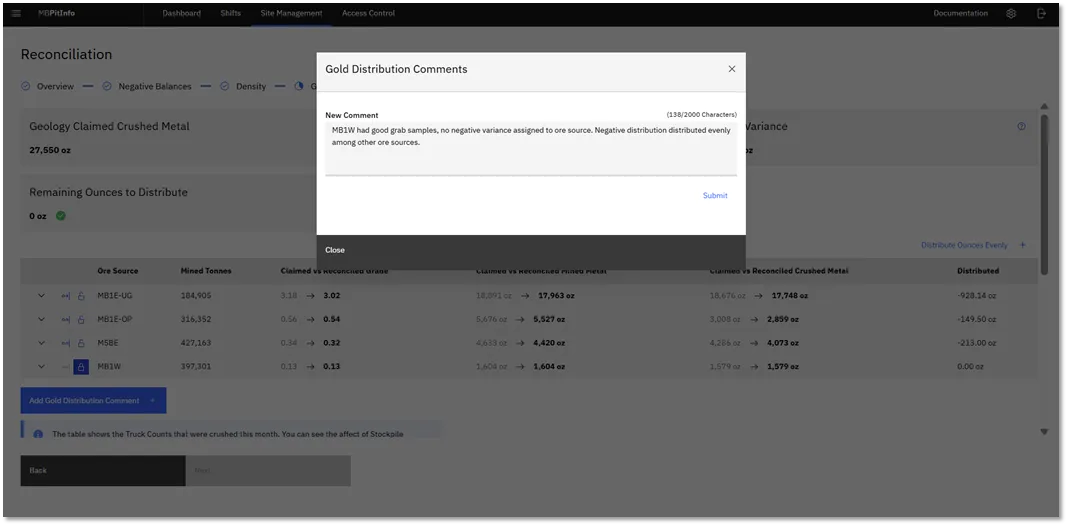
- Grab samples: indicate particularly poor grade performance from one ore source, leading to a disproportionate allocation of variance.
- R and F reconciliation factors: metal can be distributed to the ore sources to minimize the R2, and F1 reconciliation factors.
- Geological intuition: based on visual cues, past performance, and their professional opinion.
- Minimize royalty costs: not all ore sources are necessarily on the same mineral lease and may have different royalty agreements. This creates an incentive to allocate negative variance and divert positive variance from the high-royalty ore sources.
- Strategic ore sources: perhaps the operation has spent a large CAPEX bringing a new ore source into operation or one ore source is the cornerstone of the operation while the others are shorter term mill feed. The strategic ore sources are more likely to receive more positive variance than the other ore sources.
What are the implications to royalty holders?
If we expand on the example to include the following assumptions:
- Minebright Royalties holds a 3% NSR on Pit 2
- There are no royalties on Pit 1
- Gold price is US$3,000
Minebright Royalties is paid on the gold produced from Pit 2. However, the mill requires a blended feed to maintain throughput so any metal produced from the operation is a combination of metal from both pits.
The operator has an incentive to divert ounces from Pit 2 to Pit 1 to minimize the royalty payments. When the operator closed their month, they assigned all the negative metal variance to Pit 2. The final reconciled metal for Pit 2 is reduced from 6,856 oz to 6,268 oz, a difference of -588 oz:
 When the metal variance was distributed between the ore sources:

 Even in a well reconciling operation (F2 0.91), the opportunities for distorting royalty payments are obvious. When ounces are distributed based on metal, Pit 2 has 9.1% more reconciled ounces than when it receives all the negative variance. This lost metal would be even more dramatic in operations with a worse F2 factor, and where the high-royalty ore source is a smaller percentage of total metal, such as in a hub-and-spoke model.
If the following month, the F2 factor was 0.75 (12,126 oz claimed, 9,094 oz claimed), the annual revenue loss would be much higher:
 Pit Info allows for geologists to document their decisions at end-of-month, requiring justification whenever the metal distribution goes against the stated procedures. The software allows for organizations to enforce rules for allocating metal variance, whether that be: distributed weighted based on metal, minimize F3 or R3, or allow the geologist the discretion to make variance distributions based on their professional opinion.
Closing Thoughts
Assigning metal variance back to ore sources is more than a spreadsheet exercise, it’s a governance challenge with a potentially significant financial implication. Pro-rata allocation offers a transparent baseline, but royalty, streaming and political incentives often skew the split. Even small misallocations can cost royalty holders hundreds of thousands or more each year. Pit Info’s audit trails and variance-allocation policies make every adjustment traceable and unbiased. Documenting, version-controlling and regularly reviewing allocation rules as new ore sources or royalty/streaming contracts emerge mitigates risk and preserves stakeholder trust.
A Royalty or Streaming partner may have based their cashflow projections and investment decision on a production profile from a feasibility study. During operations, metal production will likely not match the original study. It may yield more or less than forecasted. Less metal production and less revenue may be due to poor mining or processing practices, an inaccurate resource/reserve model, or could be an intentional effort to minimize royalty costs to the operation. The Royalty/Streamer may want to understand the reason to see if mitigation measures are possible. Mine reconciliation is the path towards any mitigation.
Reach out to the Minebright team at info@minebright.com if you’d like to learn more about mine reconciliation, Minebright’s Pit Info application, or chat about the implications of mine-to-mill reconciliation.