


Stockpile Management and the Implications to the Balance Sheet
Geologists have control on how stockpile’s metal balance is calculated which has a direct effect on the balance sheet.
This is the fourth article on mine reconciliation and the Pit Info software integration. The first three articles can be found at these links:
- Introduction to Mine Reconciliation
- Reconciling Mine Production: A Step-By-Step Guide
- Mine-to-Mill Reconciliation: Implications for Royalties
After introducing the concept of mine reconciliation, and covering the “how to”, we now expand on how stockpile balances are calculated, and how the approach used affects the corporate balance sheet.
In the examples given, all dollar values will be in United States Dollars unless otherwise noted.
B2Gold, in their 2024YE financial statements, had $62 M of stockpile inventory as a current asset, and an additional $68 M of long-term stockpiles as non-current assets, for a total of $130 M of recorded value in ore stockpiles. Understanding how stockpile balances are calculated are an important part of understanding the value of operations and companies.
Crusher Feed Strategies
How you feed a crusher from multiple stockpiles directly affects both the head grade of the crushed material and the remaining stockpile inventory balance. Three common strategies are FIFO (first-in, first-out); LIFO (last-in, first-out); and weighted‐average. Each of these approaches allocate tons and grades differently.
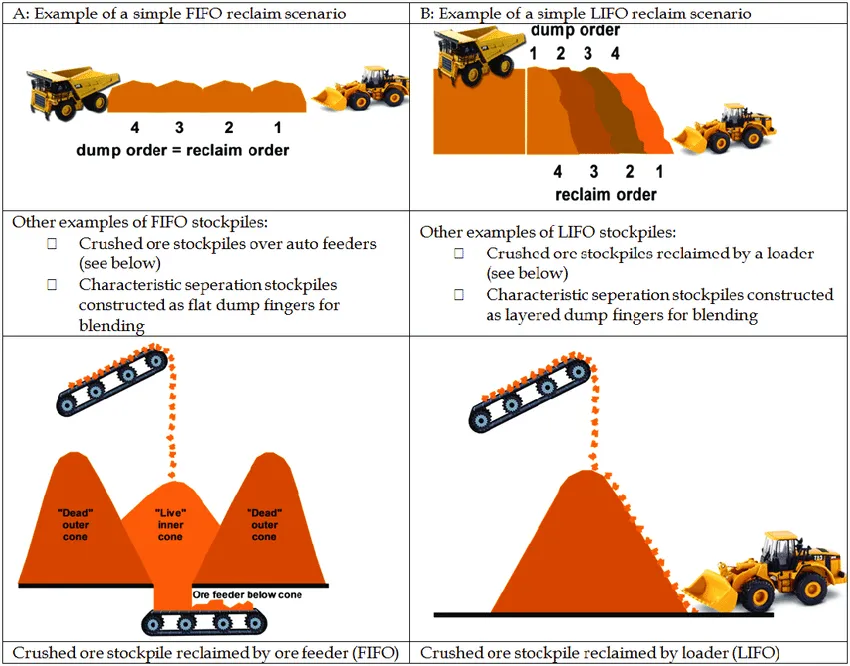
- Under FIFO, the oldest material in a stockpile is depleted first, which can yield higher grades early if high‐grade benches were added earlier.
- LIFO reverses that logic, pulling the newest material first, which may make it easier to test the quality of fresh ore but risks leaving older, higher‐grade material behind.
- With weighted average, or blended, the crushed grade is proportionally blended based on the relative volumes of each source.
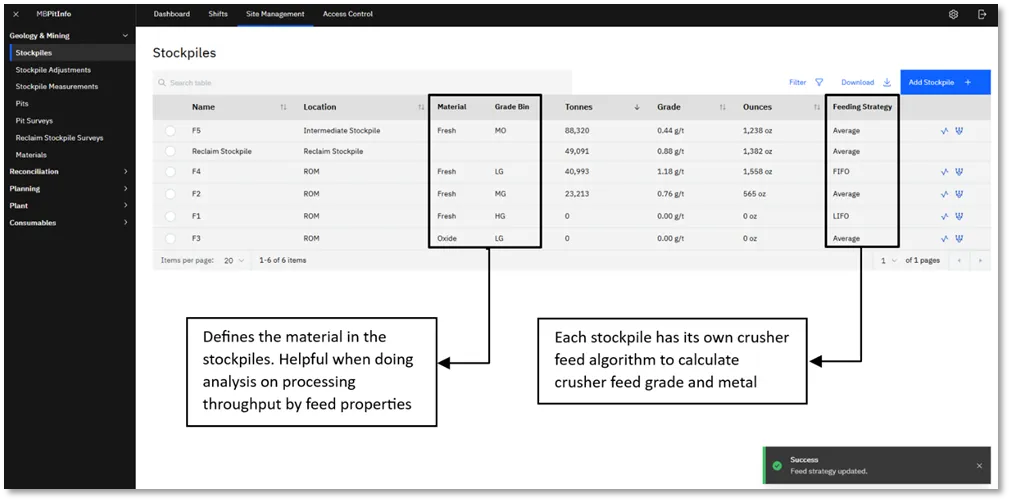
As seen in the screen shot from Minebright’s Pit Info software below, feeding strategies may differ from stockpile to stockpile. Pit Info helps manage feeding strategies and maintains records of changes.
 The following image is from Craig Morley’s conference paper, Mine value chain reconciliation – demonstrating value through best practice. It shows cases where FIFO and LIFO are the feeding strategies. However, even in cases where the feeding strategy should be FIFO or LIFO, it’s unrealistic to expect that reality perfectly reflects the ordering. Tracking a FIFO and LIFO feeding strategy without mine production tracking software, such as Pit Info, is difficult.
 By logging ore‐source attributes (grade, bench location) for each loader transaction, Pit Info can generate a dynamic, within‐pile grade map. For example, if Stockpile Green receives 10 000 t @ 4 g/t from Block A and 5 000 t @ 2 g/t from Block B, the aggregate average is 3.33 g/t. But if Block A material was almost exclusively dumped when first building the stockpile, then blending strategies that draw from one end can drastically alter blend grades. Periodic grab sampling (e.g., cone‐and‐quarter) or automating real‐time belt sampling at reclaim feeders helps validate or correct the “average claimed grade.” By reconciling within‐pile grade variability, geologists can target sampling upgrades or adjust blending rules before the crushed product reaches the mill.
Implications of Feeding Strategies
Based on the selected feeding strategy, the calculated metal in a stockpile can differ significantly. For example, take the following two tables which show theoretical deliveries to an ore stockpile.
| Load Haul ID | Date | Tonnes | Grade, g/t | Metal, g |
|---|---|---|---|---|
| 1 | Jan 1 | 1,000 | 1.00 | 1,000 |
| 2 | Jan 2 | 1,000 | 2.00 | 2,000 |
| 3 | Jan 3 | 1,000 | 3.00 | 3,000 |
| 4 | Jan 4 | 1,000 | 4.00 | 4,000 |
| 5 | Jan 5 | 1,000 | 5.00 | 5,000 |
And this table that shows a reclaim from the stockpile to the crusher:
| Crusher ID | Date | Tonnes | Grade, g/t | Metal, g |
|---|---|---|---|---|
| 1 | Jan 5 | 1,000 | ?? | ?? |
What is the grade of the material being fed to the crusher? What is the grade of the remaining stockpile? The answer depends on what stockpile feeding strategy was used. The following table shows the claimed grade and metal for 1000 tonnes fed to crusher as a function of feeding strategy:
| Feeding strategy | Feed grade, g/t | Feed metal, g |
|---|---|---|
| Blended | 3.00 | 3,000 |
| FIFO | 1.00 | 1,000 |
| LIFO | 5.00 | 5,000 |
And the remaining stockpile balance as a function of feeding strategy:
| Feeding strategy | Stockpile grade, g/t | Stockpile metal, g |
|---|---|---|
| Blended | 3.00 | 12,000 |
| FIFO | 3.50 | 14,000 |
| LIFO | 2.50 | 10,000 |
As we discussed in the second post, the claimed stockpile balance is an important value when reconciling ore mined so the implications of feeding strategy can have far-reaching implications to reported production.
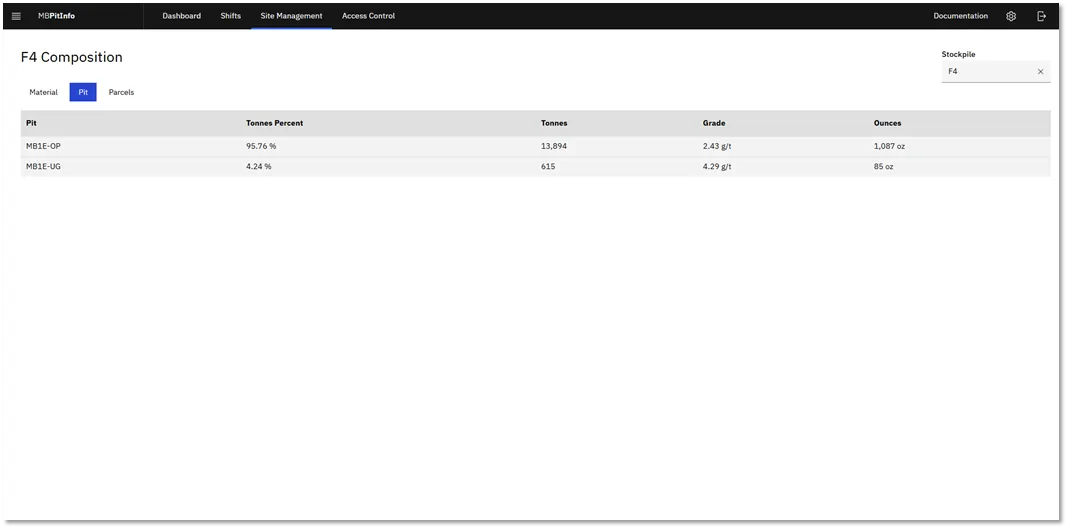
To maintain full traceability, and to protect against blending biases, each loader transaction should include a clear ore‐source ID (for example, “Pit A - HighGrade” or “Pit B - LowGrade”). By organizing ore into substockpiles based on its origin and grade, you can track exactly where every bucket of material came from and where it goes. This metadata tagging lets you generate audit trails showing which stockpile fed the mill at any moment. The screenshot below from Pit Info shows the breakdown of a stockpile named F4 by mine.
Loose Densities and Volume-to-Tonnage Conversions
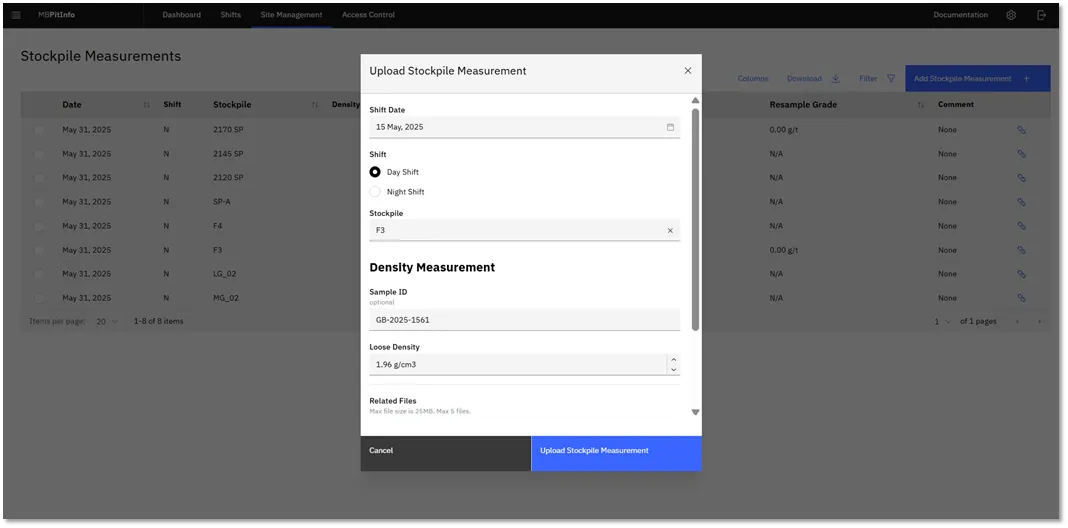
Stockpile tonnage is calculated by multiplying surveyed volume by an assumed loose density, making density assumptions critical. If a stockpile’s surveyed volume is 50 000 m³ and its assumed density is 1.6 t/m³, it holds 80 000 t. Change that density to 1.55 t/m³—perhaps based on new density tests, and the same volume equates to only 77 500 t, a 2,500 t swing (3.1 %). In large operations, even a one‐percent density error can translate to millions of dollars of mis‐valued inventory.
The loose bulk density is based on the insitu density, the swell factor when mined, and the re-compaction factor when placed into a stockpile by mobile equipment. It can be difficult to accurately portray the loose density within a stockpile, hence density can be one source of error identified by reconciliation.
Many mines periodically collect bulk samples or use empirical correlations (moisture, particle size, compaction) to refine their density assumptions. By tracking density inputs and survey dates in a centralized system, such as Pit Info, reconciliation software can alert users when a major stockpile’s tonnage shifts simply due to a density‐update, rather than actual movement of ore.
Stockpile Survey Methodology and Common Errors
Stockpile surveys drive the volume measurement that underpins the tonnage calculation, but they’re susceptible to multiple sources of error. Drone or LiDAR topographic mapping is increasingly popular for its speed, and should be considered the default in most cases, but equipment calibration, GPS signal drift and surface‐resolution limits can introduce ±2–5 percent volumetric uncertainty. If a stockpile’s actual volume is 20,000 m³ but errors cause the survey to record 19,400 m³ (–3 %), the derived tonnage might be 30,800 t instead of the true 32 000 t (assuming 1.6 t/m³). That 1,200 t difference feeds directly into reconciliation ratios and balance‐sheet inventories.
Accounting and Stockpiles
Stockpile inventories appear on the balance sheet at either cost or net‐realizable value (NRV), whichever is lower. To value a stockpile, you multiply calculate the recoverable value in the stockpile, then subtract processing and transportation costs.
 Suppose Stockpile Alpha has:
- 30 000 t @ 1.5 g/t Au
- Gold at $2 000/oz
- Recovery 95%
- Payable 99% percent.
- Processing cost at $25/t
- Selling cost at $0/oz
Then NRV = $2.0 M.
If mining costs average $60/t, the cost basis is $1.8 M, so you’d carry the pile at Cost ($1.8 M). If gold falls to $1 500/oz or recovery drops to 80 percent, NRV could dip below cost, triggering an impairment.
Large stockpiles, like B2Gold’s $130 M of ore inventory, carry significant financial risk if price swings occur. Highlighting these valuation mechanics clarifies why accurate tonnage and grade inputs are essential not just for operational reconciliation but for quarterly and annual financial reporting.
Closing Thoughts
Stockpile management is far more than “stack it and forget it.” How you feed the crusher, FIFO, LIFO or weighted‐average, not only shapes your blended crushed grade but also reverberates through month‐end reconciliation and financial reporting. A seemingly small change in loose density (e.g., from 1.60 to 1.55 t/m³) can swing inventory tonnage by thousands of tonnes, translating into millions of dollars in mis‐valued assets. Survey errors, whether from drone‐based LiDAR or traditional total‐station cross-sections, compound those risks by introducing volumetric uncertainty that feeds directly into both operational KPIs and balance‐sheet figures.
Accounting rules demand that you carry stockpiles at the lower of cost or NRV, so accurate tonnage, grade and price inputs are non‐negotiable. When market prices slip or recoveries dip, a once‐healthy pile can suddenly warrant a write-down, affecting quarterly earnings and investor confidence. Beyond the numbers, tagging every loader transaction with an ore‐source identifier, especially in high-royalty vs. low-royalty scenarios, ensures you maintain transparency, prevent disputes and protect royalty revenues.
In short, disciplined tracking of feeding strategies, density updates, survey schedules and ore‐source metadata is the foundation of a trustworthy reconciliation process. By embedding these controls and leveraging tools like Pit Info to automate audit trails, you not only keep operations aligned but also safeguard balance-sheet integrity.